Manual de utilización de la plataforma
¿Dudas sobre SmartyPlanet? aquí tenemos las respuestas
-
 Primeros pasos
-
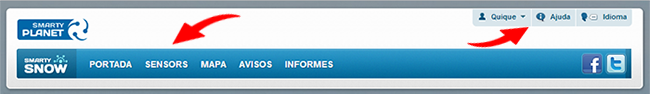
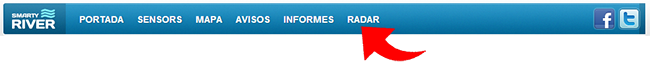
Menú de navegación
Se compone de dos bloques, el central y el superior. El superior permite modificar los datos de la cuenta de usuario, visualizar la ayuda y cambiar de idioma. El menú central permite navegar por todos los apartados de la web. La portada, donde se visualizan los sensores favoritos y un mapa con la ubicación de las estaciones. Los sensores, donde se listan las estaciones con su contenido. El mapa, donde se muestran las estaciones georeferenciadas sobre google maps o sobre sinóptico. Los avisos, donde se pueden ver los avisos disparados y generar nuevos. Los informes, donde se generan documentos detallados en formato PDF a partir de gráficos.
-
Panel de control / Dashboard
El panel de control es un bloque que muestra los sensores favoritos del usuario, y le permite tener su propia configuración y personalización de la plataforma. Inicialmente el dashboard aparece vacio y se pueden añadir tantos como se deseen.

-
¿Qué es un sensor?
Un sensor es el nombre que se le da a la representación gráfica de los datos en tiempo real. Estos datos hacen referencia a una o varios canales de una estación. Los canales que originan estos datos pueden ser de nivel, temperatura, humedad, radicación, etc.
-
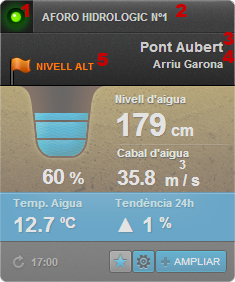
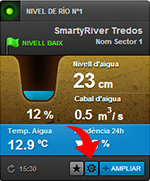
1 - Indica que la estación tiene un funcionamiento correcto
2 - Nombre del sensor
3 - Nombre de la estación
4 - Nombre del sector
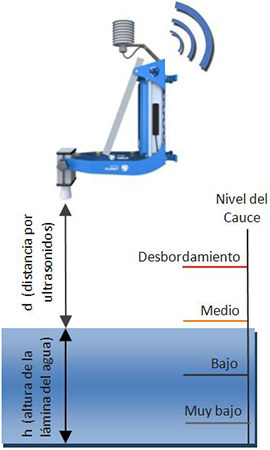
5 - Nivel de río en función de la altura del agua y la capacidad de le llera
| Nivel |
Descripción |
|
Nivel Bajo
|
Capacidad del río no superior al 25% del total. No hay peligro inminente de desbordamiento en esta zona
|
|
Nivel Medio
|
Capacidad del río entre 25%-50% del total. No hay peligro inminente de desbordamiento pero es recomendable seguir la evolución
|
|
Nivel Alto
|
Capacidad del río entre 50%-75% del total. Es necesario seguir atentamente la evolución del rio, crear avisos con el fin de detectar posibles problemas |
|
Nivel Muy Alto
|
Capacidad del río entre 75%-100% del total. Es muy probable que el rio empiece a desbordar en algun punto de este tramo
|
-
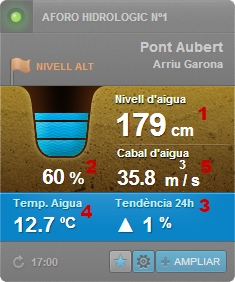
1 - Altura del agua, nivel de la superficie del río
2 - Estado de la capacidad de la llera
3 - Evolución del nivel del agua en las últimas 24h
4 - Temperatura superficial del agua
5 - Caudal por secciones aforadas o de simulación hidráulica
-
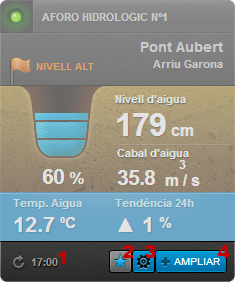
1 - Hora del último registro del sensor
2 - Marca el sensor como favorito y este aparecerá en la portada
3 - Acceso a la configuración del sensor
4 - Acceso al conjunto de gráficos y estadísticas del sensor
-
-
¿Cómo añadir sensores a mi dashboard?
-
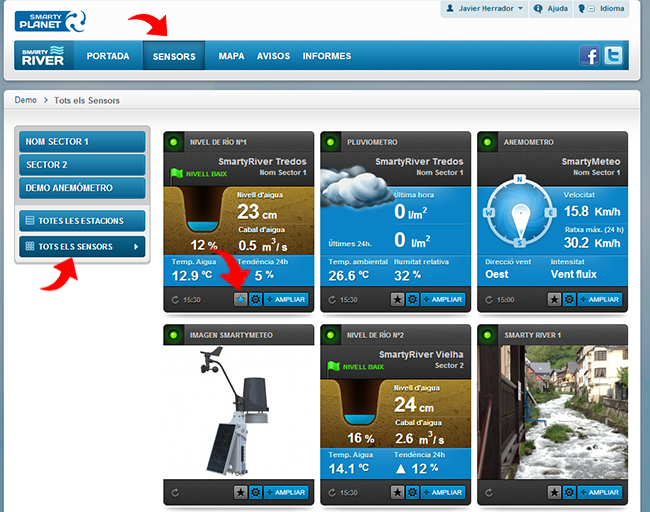
Para añadir un sensor al panel de control, se tiene que marcar el botón con forma de estrella del sensor. Se puede hacer desde cualquier punto de la plataforma donde se visualiza el sensor. Además en el apartado de configuración del sensor tenemos también esta opción. Para ver todos los sensores disponibles se tiene que acceder al apartado sensores y filtrar por todos los sensores
-
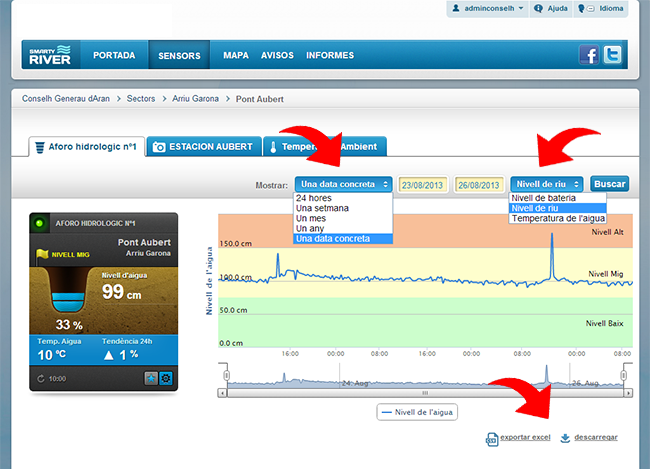
¿Cómo exportar a Excel?
-
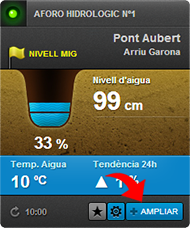
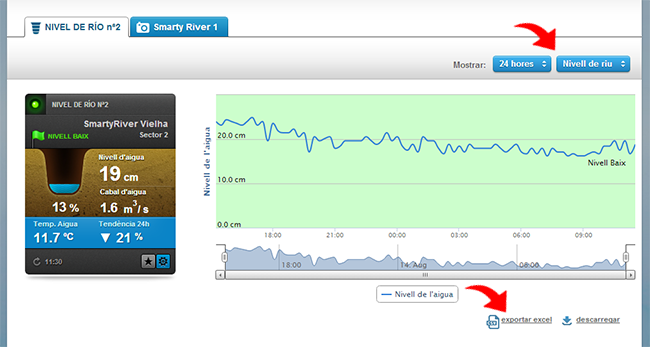
Para exportar los datos en formato excel, el usuario tiene que acceder a la información ampliada del sensor y apretar el botón exportar Excel. A continuación se descargará un fichero Excel con los datos que se visualizan en la gráfica. Si se desean exportar datos de otro periodo o canal, se debe modificar primer el filtro de la gráfica
-
¿Cómo crear y configurar avisos?
-
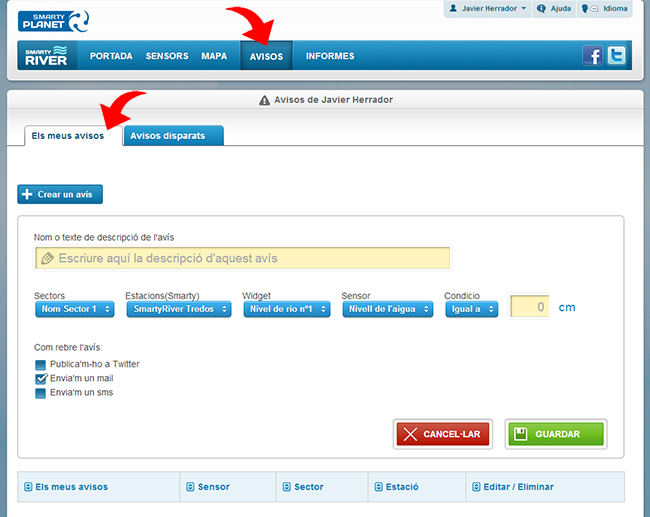
Apartado avisos
En este apartado se pueden crear y configurar avisos cuando una estación supere o no un determinado valor. Además se puede configurar la forma de notificación, bien sea por correo, sms o con una publicación en twitter. En este apartado se pueden generar avisos de cualquier estación y sensor.
-
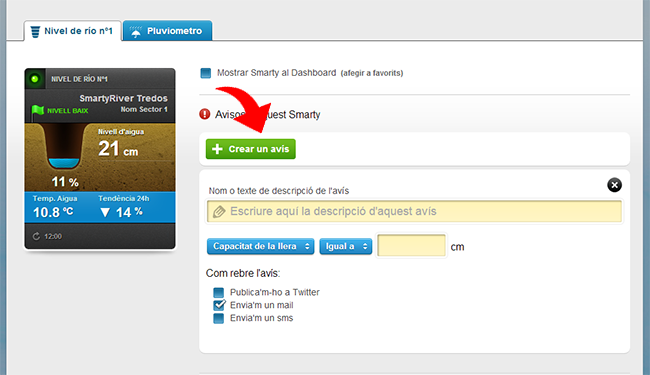
Apartado configuración del sensor.
El usuario puede configurar también, avisos directamente desde el sensor. Para acceder deberá de apretar el botón con forma de redonda
-
¿Cómo modificar mis datos personales?
-
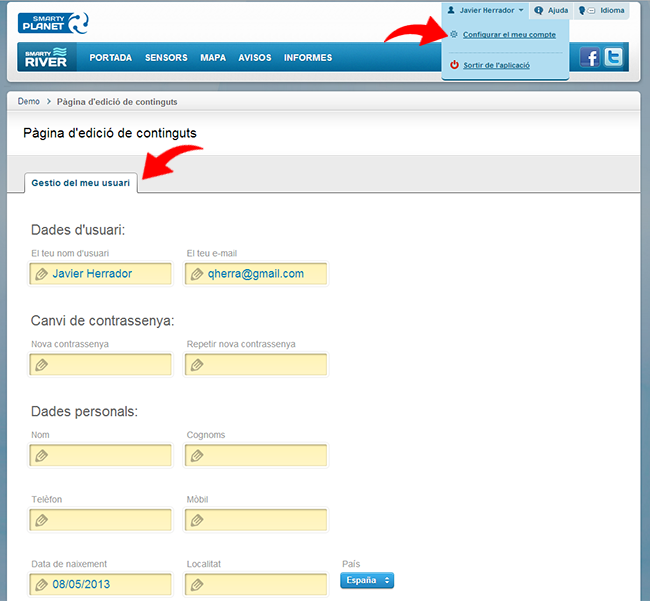
Para modificar los datos de la cuenta de usuario, se debe acceder a la "Configuración de mi cuenta" del menú superior. En este apartado se puede modificar el nombre de usuario, el email, la contraseña y otros datos personales como teléfono, localidad o fecha de nacimiento.
-
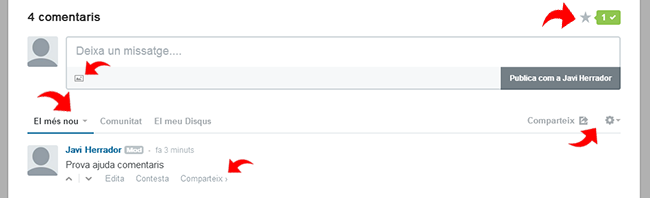
¿Cómo añadir un comentario?
-
Los comentarios se crean y se muestran según la estación que estamos visualizando. Para crear un comentario será necesario escribir el comentario y apretar publicar. Si el usuario no está registrado en este módulo, se solicitará registro por Disqus, Facebook, Gmail o Twitter. Se pueden añadir comentarios desde el apartado del sensor o de la estación.
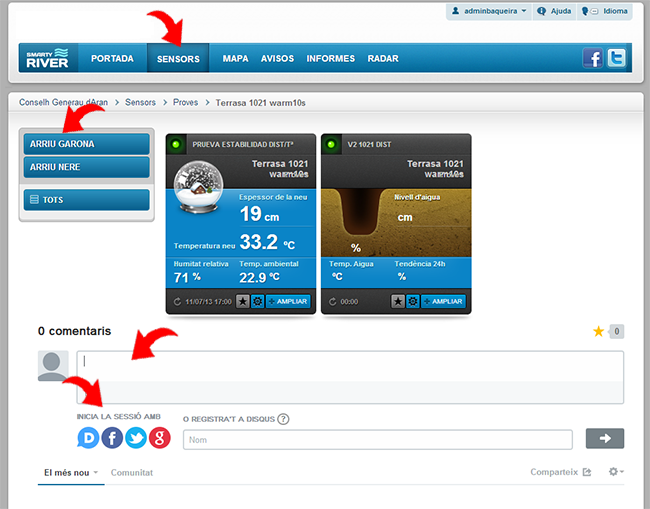
-
Además, se puede marcar el bloque de comentarios como favorito, subir fotos o compartir con las redes sociales. También se pueden visualizar videos añadiendo la URL del video al comentario. Disqus ofrece unas opciones para ordenar los comentarios según la temporalidad y la importancia, así como ser seguidor de un usuario y ver todos sus comentarios y votos.
-
¿Cómo consultar datos históricos?
-
Accediendo al detalle del sensor, se puede consultar los datos histórico de este. Este apartado permite visualizar datos de las últimas 24 horas, la última semana, el último mes y año, o bien seleccionar periodos concretos. Además permite consultar todos los canales disponibles en esta estación, exportar los datos en formato excel y bien descargar una imagen del gráfico.
-
¿Qué es un canal?
-
Un canal es un sensor físico que mide un parámetro determinado, nivel, temperatura, humedad, radiación, velocidad y dirección del viento, etc.
-
¿Cómo ver las estaciones en el mapa?
-
Este apartado muestra todas las estaciones georeferenciadas, cada una en su grupo o sector de ubicación. Este mapa permite filtrar las estaciones según tengan o no un determinado sensor. Las estaciones se pueden visualizar georeferenciadas sobre mapa, o bien sobre un mapa sinóptico. Al pasar el cursor por encima de la estación, se despliega el listado de sensores con el valor actual. Se puede acceder a la estación haciendo click en el dibujo de la estación, y a la información detallada de cada sensor haciendo click en el sensor.

-
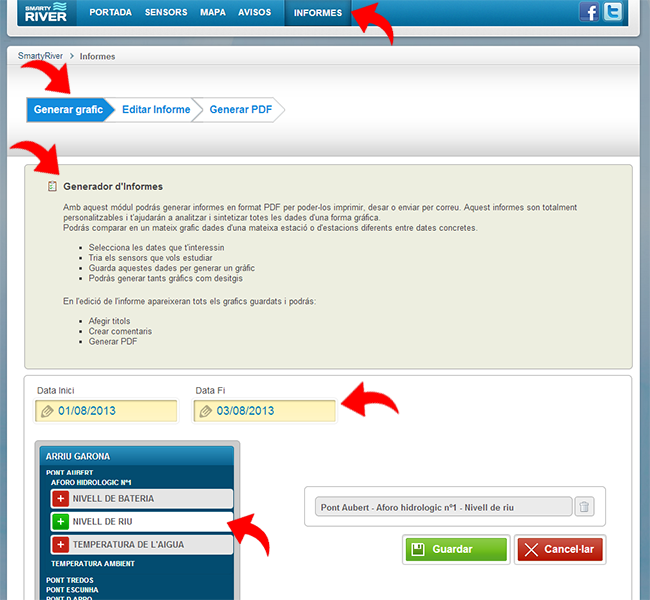
¿Cómo crear informes personalizados?
-
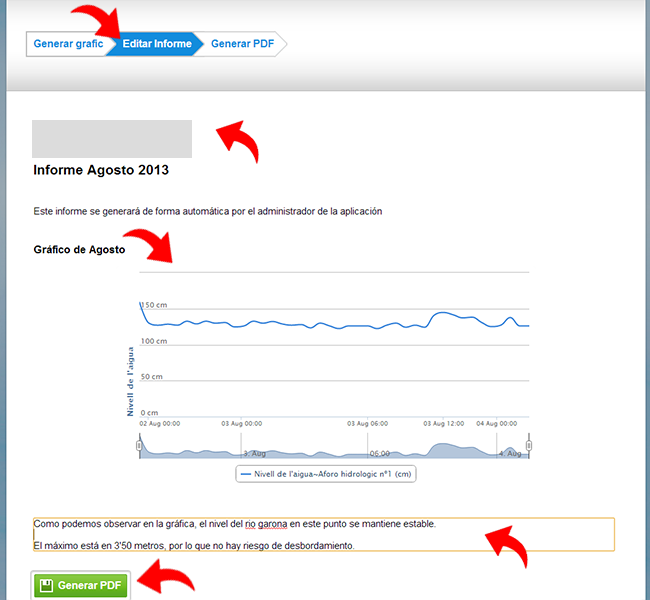
Generación de gráficos
Los informes personalizados se crean desde el apartado Informes. Primero se tienen que añadir los gráficos que se quieren comentar en el informe, para hacerlo se debe seleccionar el periodo de los datos y posteriormente el canal. Una vez se ha guardado este gráfico se puede añadir más o ir directamente a la edición del informe.
-
Edición del informe
El informe se compone del logo corporativo, un título y una descripción del informe, y un bloque que hará referencia a cada uno de los gráficos con un título, una imagen y un comentario. Una vez se ha finalizado la edición se puede generar un PDF descargable e imprimible
Manual de comprensión de las metodologías de cálculo
Funcionamiento y obtención de datos
-
¿Cómo funciona el ecosistema SmartyPlanet?
-
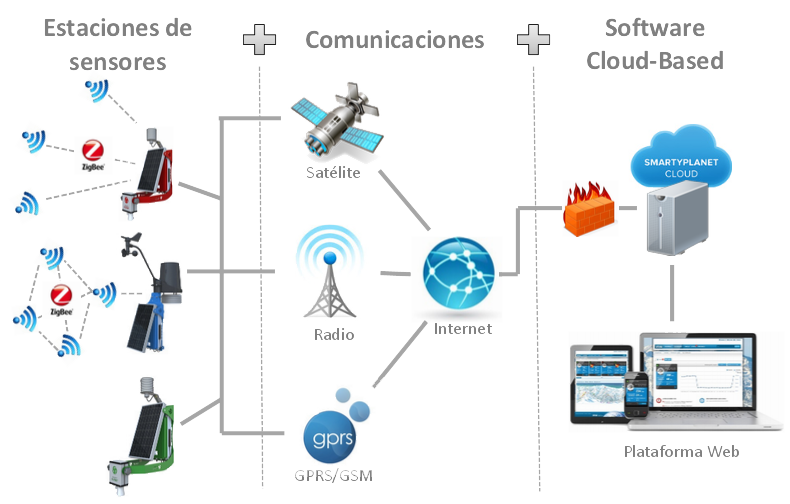
La arquitectura de las redes de sensores SmartyPlanet se basa en tres capas bien diferenciadas:
-
1. Estaciones de sensores
Consisten en Dataloggers robustos y autónomos a los que se le conectan unos sensores especializados con el objetivo de medir y monitorizar cualquier parámetro ambiental o de proceso productivo.
-
2. Comunicaciones inalámbricas
Los datos medidos los sensores se envían periódicamente a un Servidor Cloud mediante módem M2M GPRS de la infraestructura de telefonía móvil y se almacenan en una Base de Datos segura y estable. Para localizaciones sin cobertura telefónica se utilizan comunicaciones satelitales o enlaces de Radio para inyectar los datos en internet.
-
3. Centro de Proceso de Datos y Plataforma web
La enorme cantidad de información recogida por los sensores se procesa en unos servidores seguros. Allí se almacenan y presentan en una interfaz de usuario de una forma amigable mediante una plataforma web personalizada y conforme a los estándares de la web 3.0.
-
-
¿Cómo funciona el sensor de nivel de río?
-
¿Cómo funciona el sensor de caudal?
-
Para la medición del caudal circulante en los ríos existen varios métodos posibles. Smartyriver utilizamos según corresponda las siguientes metodologías:
-
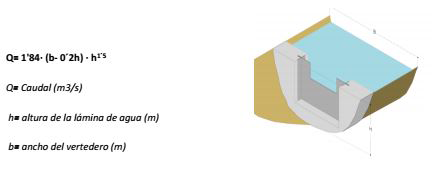
1. Altura del agua en vertederos de aforo
Se coloca aguas abajo del sensor de altura de lámina de agua un vertedero rectangular de aforo de labio fino, a fin de poder establecer una relación inequívoca entre la altura de la lámina de agua y el caudal correspondiente.
-
2. Modelización hidráulica
En este caso, para determinar el caudal conociendo la altura de la lámina de agua se modeliza hidrológicamente la sección donde queremos medir con la ayuda de la aplicación informática (HEC-RAS). De la modelización informática se obtiene una relación directa entre el calado o nivel de agua y el caudal, es lo que se conoce como "curva de gasto".
Este modelo matemático particular para cada punto de control se incorpora a la plataforma para mostrar el caudal resultante a partir de la altura medida.
Para realizar este modelo deben introducirse en el cálculo diferentes parámetros como las secciones hidráulicas, la pendiente del rio, la rugosidad del lecho y de las márgenes, etc..
-
3. Aforos manuales
Se elaboran las curvas de aforo que relacionan calado y caudal mediante campañas de mediciones en los puntos de control. Las curvas resultantes se incorporan en la plataforma web para obtener el caudal a partir de la altura de agua medida por el sensor.
Es necesario que los puntos donde se realizan las mediciones tengan una geometría específica para que el calado del rio no se vea afectado por perturbaciones aguas arriba o abajo del punto de medida.
Las campañas de aforo consisten en la medición de la distribución de velocidades existentes en el flujo del rio para una sección determinada. Deben realizarse campañas para los diferentes regímenes de funcionamiento estacional del río.
-
4. Sensores de Caudal
Se instalan sensores especiales en el lecho del río que miden la sección de agua y la distribución de velocidades. De esta manera se puede conocer el caudal circulante de manera directa y con mucha precisión. Existen diferentes tecnologías para estos sensores; Tiempo de Tránsito, Efecto Doppler, etc..
-
¿Cuál es el tiempo de reacción de los avisos asociados a las diferentes alarmas?
-
El módulo de avisos de la plataforma web funciona de la siguiente manera:
Las estaciones remotas leen los valores de los sensores y envían estos datos a los servidores del Centro de Proceso de Datos periódicamente (generalmente cada 15 minutos, dependiendo del tipo de estación).
Inmediatamente al recibir la información, el CPD comprueba si alguno de los valores supera algún umbral establecido en los avisos de la plataforma, y si es así lanza el aviso en la web, por email a todos los usuarios o por sms si así se ha indicado en el módulo de avisos de la plataforma web.
De esta manera y con buen funcionamiento de las telecomunicaciones, el retardo máximo en ser publicado el aviso en la web desde que sucede el evento no llega a ser mayor de 16 minutos
-
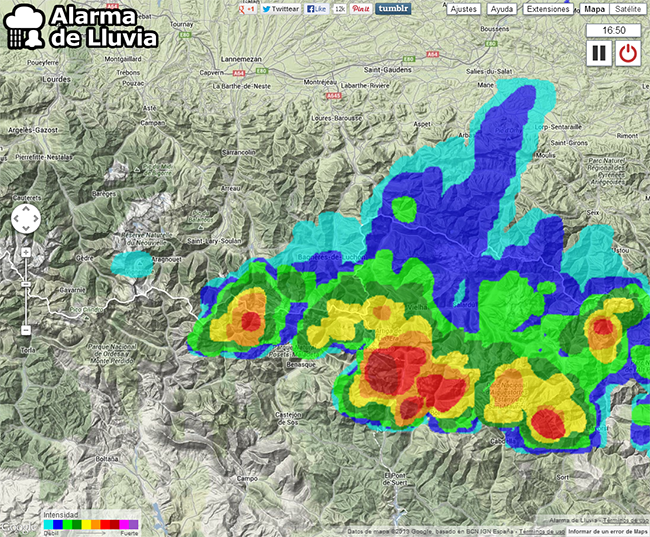
¿Que es el radar meteorológico?
-
El radar meteorológico abrirá una nueva ventana con el mapa y la precipitación de los últimos minutos. Estos datos son externos a SmartyPlanet y proceden del website de Rain-Alarm.El uso de estos datos se debe complementar con otros datos meteorológicos para su correcta interpretación. SmartyPlanet no se hace responsable del uso inadecuado de esta información, ni de su veracidad.
-
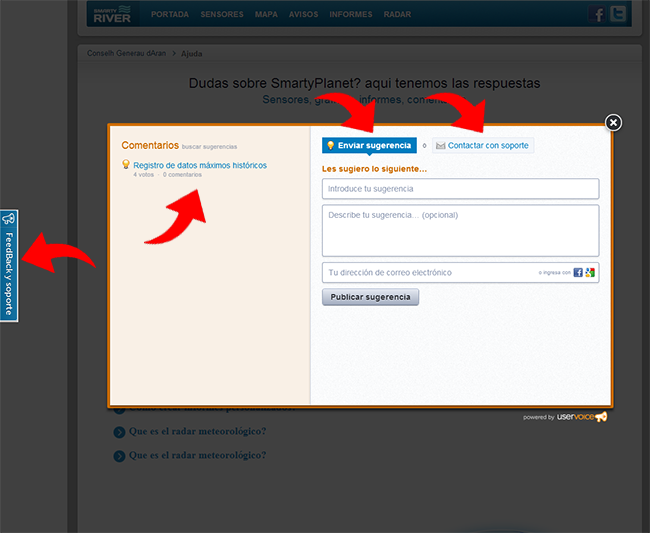
¿Sigues con dudas?
-
Si todavía tienes dudas puedes ponerte en contacto con nosotros llamándonos al +34 973 640 972 o enviándonos un correo a info@smartyplanet.com. Como es muy importante para nosotros mejorar nuestra plataforma, hemos añadido un bloque de Feedback y soporte. En él podrás enviarnos propuestas de mejora, votar ideas que te parezcan interesantes o enviarnos una incidencia.

 Castellano
 Català
 Euskera
 Aranés
 Français
 English